Content Marketing – A Complete Guide
Visuals have become a key component and one of the most popular content marketing trends. For communication to be effective, marketers need to offer more than simple blocks of text, and that is why visuals, such as infographics and mind maps, have become so popular.
Although images are often treated as mere decorative elements to the text, visuals must be planned with a purpose. However, it can be challenging to create visuals that are organized, attractive, and effective. In this article, you will see how to use visuals to improve your marketing strategy, engage your audience, explain concepts and organize information.
Mind Maps
When creating a project, brainstorming, or setting goals, people use to have many ideas. But it can be challenging to compare, evaluate or choose the best ones. The lack of clarity of the big picture makes it hard to take the right actions, and in such cases, you only need to have a clear view of your main ideas to make things easier.
A good strategy is the first step for great achievements. When you are creating or adapting your marketing strategy, the best way to organize and visualize ideas is by mind mapping. Mind maps are a technique to develop ideas from a central point by branching out to secondary ideas and exposing key concepts.
Mind maps are a great tool both for personal use and content marketing, helping to understand concepts, finding the best way to achieve a given goal, and sharing information in an engaging and easy-to-understand way. In short, they help to analyze and memorize information. Because of that, they are perfect for brainstorming, social media, blog posts, and more.
A mind map helps you in activities such as:
- Evaluate ideas
- Understand how different activities connect
- Brainstorm
- Share relevant data in an attractive and memorable way
- Visualization of complex data quickly
- Track progress of projects
Since you can use mind maps in so many different ways, it is important to bear in mind that depending on the purpose of our mind map, you will use more visuals, color, and images; or more data, bullet points, and ideas.
Before you start your mind map, think about what you want to understand or communicate. So, when creating your mind map, you will define the goals to be achieved, and then the strategies that will be adopted for this and the tactics or actions for each strategy.
For example, let’s say you are launching a new product. In this case, you can start at the end, the product itself and branch out actions to reach your goal. Or you can start with a problem that you want to solve and, from that, add ideas and processes to find the best solution. Just like this mind map below:
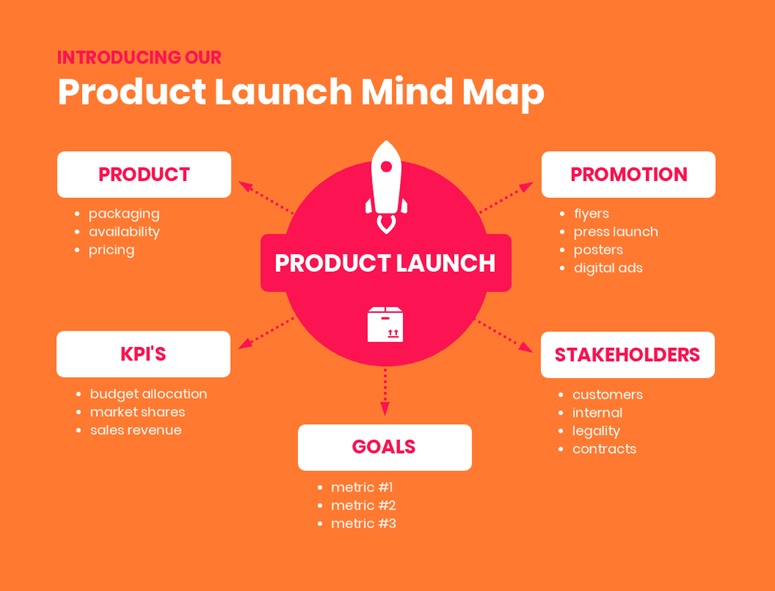
To highlight the most important information, which is essential for a good mind map, you can use design elements such as different shapes, sizes, and colors. The most relevant ideas or actions can be inserted in larger circles or colors that stand out more from others.
So you can start by keeping things simple, focusing on a few key ideas that set goals, and then dividing them using points and lists to show possible actions.
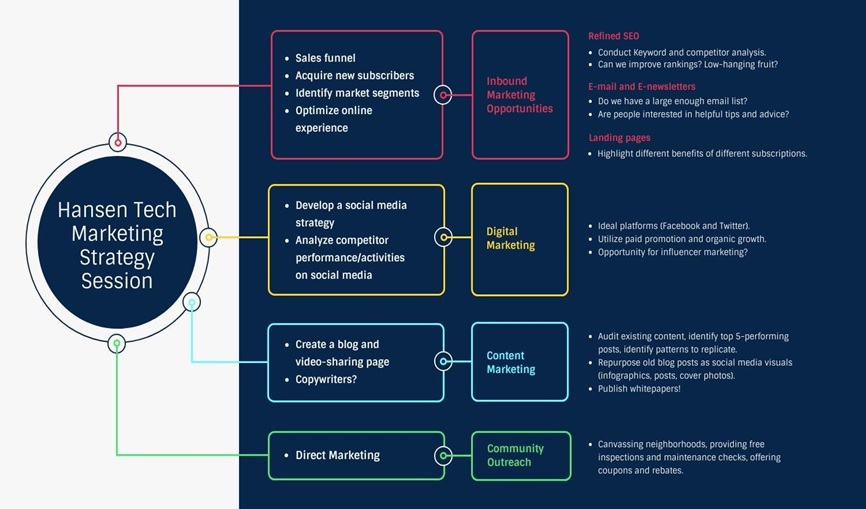
Or, on the other hand, you can opt for a more elaborate and attractive look to present and explain to your team after a few brainstorming sessions. You can also add it to your presentation or report, using icons as a visual way to explain new concepts. See, for example, this marketing strategy mind map that breaks out specific goals by the types of marketing and addresses the steps required to meet them.
If you want to put it into practice, here are 5 steps to make a mind map:
- Choose a mind map model
- Start with your central idea and branch
- Choose a theme for the mind map
- Use colors to organize information
- Create a visual hierarchy
Social Media
Social media have become one of the main spaces for interaction between brands and their audiences. Today, it is common for marketing teams to have people dedicated exclusively to engaging followers on social media.
With so many companies and professionals involved, the content created for social networks needs to be impactful, engaging, and have high value for the public. To compete with so much content generated daily, reach your audience and generate more leads, you need relevant, engaging, and easy-to-understand content.
However, how do you know which content is right for you and which will engage your audience?
Remember that most people access social media via a smartphone, and they scroll through the feed quickly and most of the time without paying too much attention, and stop the screen for a moment on something that catches their eye.
If your goal is to make them stop in your message long enough to interact with it, infographics made for social media must be simple, clear, and go straight to the point.
Using graphics such as flow charts and in the feed is a great teaser to attract your audience and make them curious enough to click on a link to a blog post or a landing page. So you can summarise a blog post on its most important aspect and share it on your favorite social media as an effective way of repurposing existing content and boost traffic to your site.
Creating Memorable Posts
If you want your message to be assimilated, the best way to do that is to present it memorably. When customizing the templates, some tips to keep in mind are:
- Few colors – With the background in one color, you can highlight the most important information and attract the eye with the use of contrasts
- Use icons to illustrate concepts – Sometimes you need an icon that reflects the theme of the content you share and a bold background color.
- Diversify the type of content – Also, take advantage of the diversity of resources available on Instagram to engage your audience and avoid boring them with a lack of variety.
- Storytelling – The number of images you can use to create your story is unlimited. As in the templates below, you don’t have to say everything in one image; you can use as many as necessary to get your message across. In this case, focus on creating content with a playful tone, insert icons, illustrations, texts, and other resources to make the content more diverse.

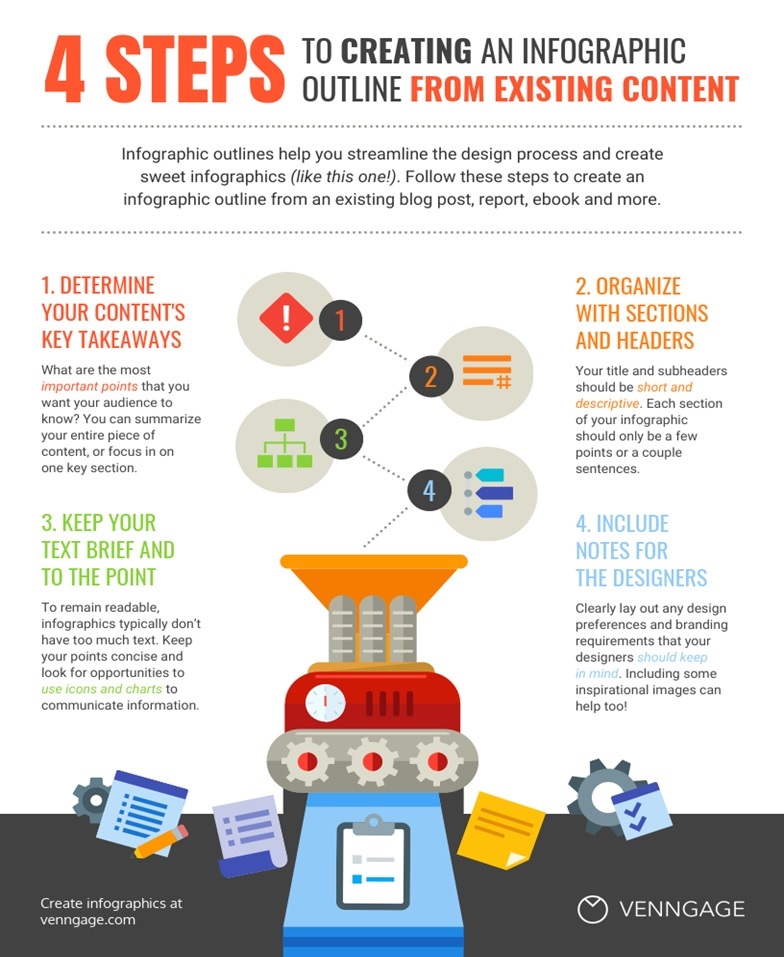
If the goal is to educate the public, infographics are great for that too, organizing a larger volume of information clearly.
In that case, remember:
- Leave space between the information for a more pleasant reading and a clean visual;
- Use a dominant color;
- Maintain visual sobriety and the organization of information;
- Know your audience and think about your persona. Remember her preferences, personality, whether she is outgoing, formal, old, young – and direct the aesthetics of your graphics with that in mind;
- Pick a free infographic maker, define the main information you want to share and try different colors, shapes, icons and illustrations.
See how it works:
Product Infographics
Product pages usually display images and a long description explaining the product’s features and benefits. But how many people really have the patience and time to read these descriptions?
This is where product infographics come into play. Content marketing statistics show that using visual aids effectively increases engagement and understanding of information, and infographics communicate the same message in a visually exciting way and make reading more engaging.
This template created for breweries, for example, presents a short text and uses the colors to highlight which style of beer is among the others available.
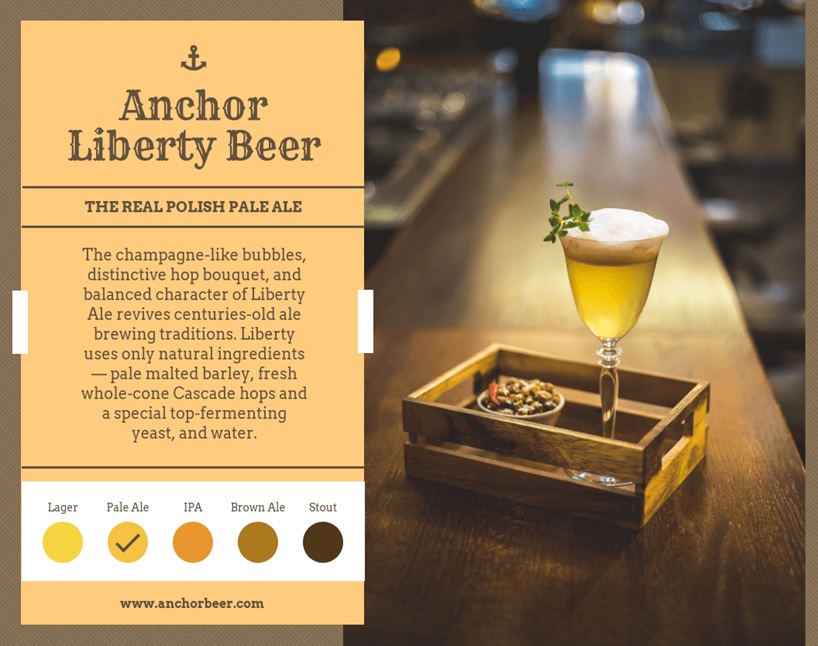
The color palette, fonts and images can be replaced according to the products when creating the infographic. So, if you want to show the main features or compare similar products, consider using customizable templates to create product infographics and provide that information more effectively.
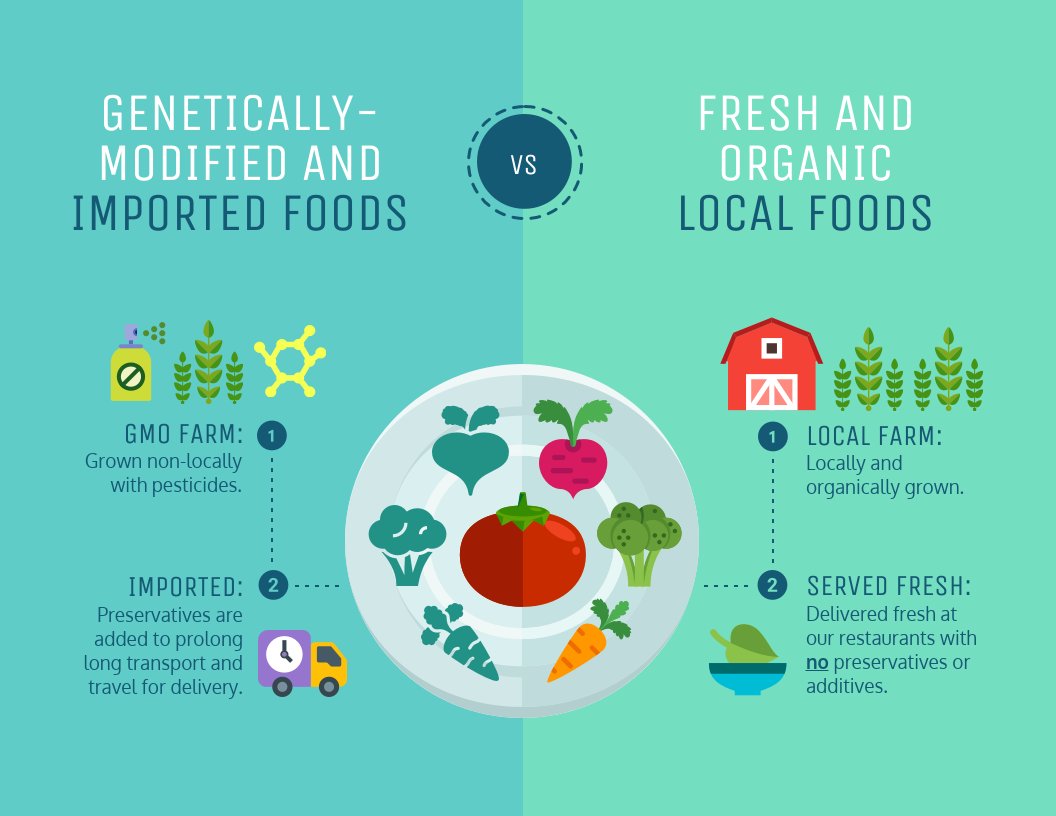
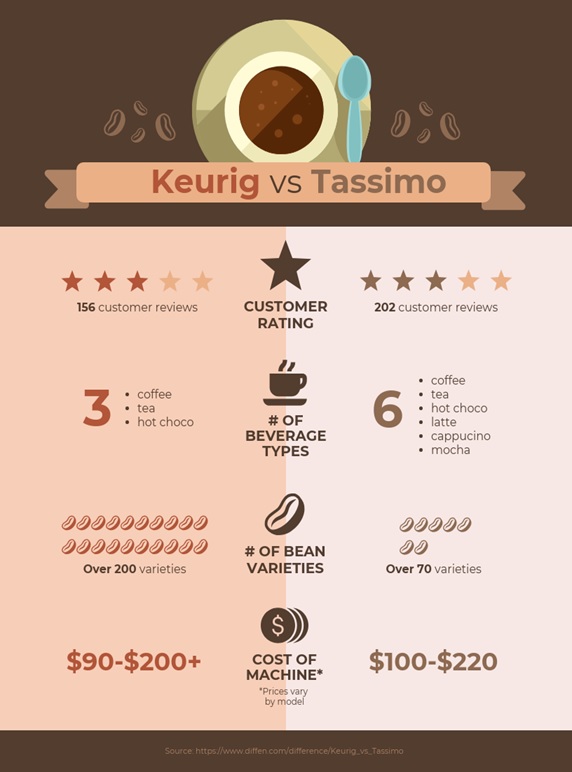
Comparison Infographic
This type of infographic is great for helping a potential customer understand which product is ideal for them, making the purchase decision faster and reducing the chances of refunding and unhappy customers.
Creating a comparison infographic is simple. You only need to list the main features of two similar products, add images and icons to illustrate the features of each one. Such a comparison infographic can highlight the superiority of a product or help the customer find the best solution for their needs.
See below how it is easier to make a choice when viewing this type of infographic:
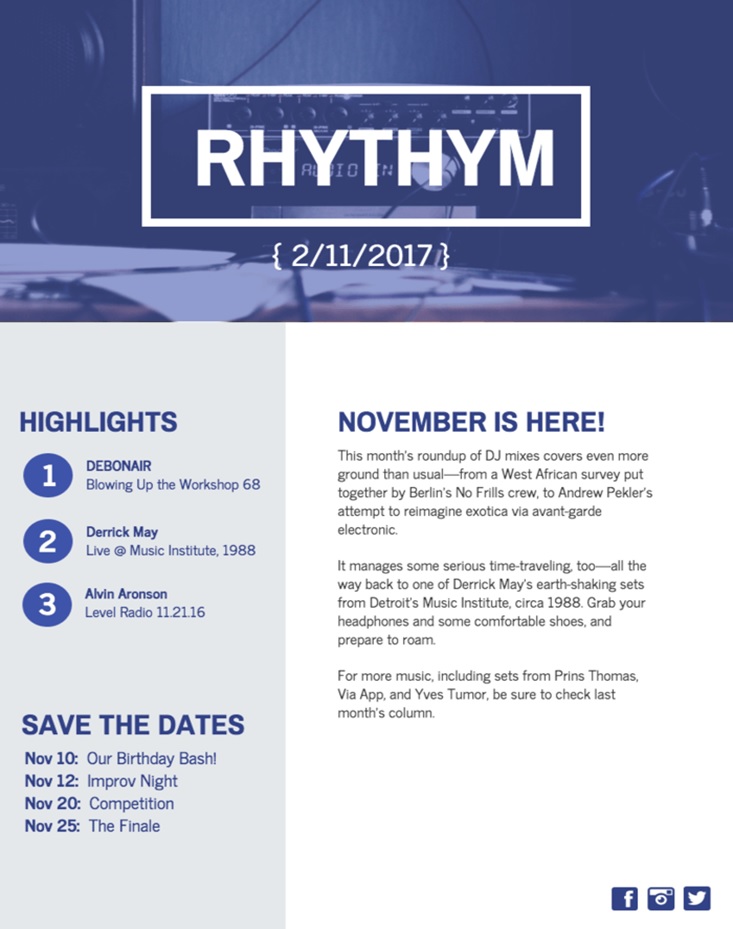
Newsletters
Many professionals may be focusing all their efforts on other ways to communicate with audiences, but the newsletter is still a very powerful tool. Email marketing is something that everyone needs to use, but sending descriptive texts can upset or bore your reader, and it is very likely which will prevent your message from being assimilated.
Using templates to create newsletters will optimize the process of creating your emails, so you can make it with the proper periodicity and deliver engaging content for your reader. See in the example below how this customizable template conveys information quickly and visually interesting:
Watch your newsletter frequency and timing, and always send only relevant content because sending emails too often will upset your audience and result in unsubscribes. You can achieve this using mailing segmentation tools. This way, you avoid sending messages that don’t make sense to your contact base, which could lead to unsubscribing or, even worse, being marked as spam and compromising all of your campaigns.
Repurpose
Repurposing existing content and presenting it under new formats is a time-saving and highly effective practice. For example, you can turn any text on your blog into engaging visuals to increase conversions and Click-Through Rate.
Let’s say you have content on your blog about how to support local businesses. You can take the main topics and organize them into five posts with an attractive look and put them on a carousel post, as in the five Instagram templates below:
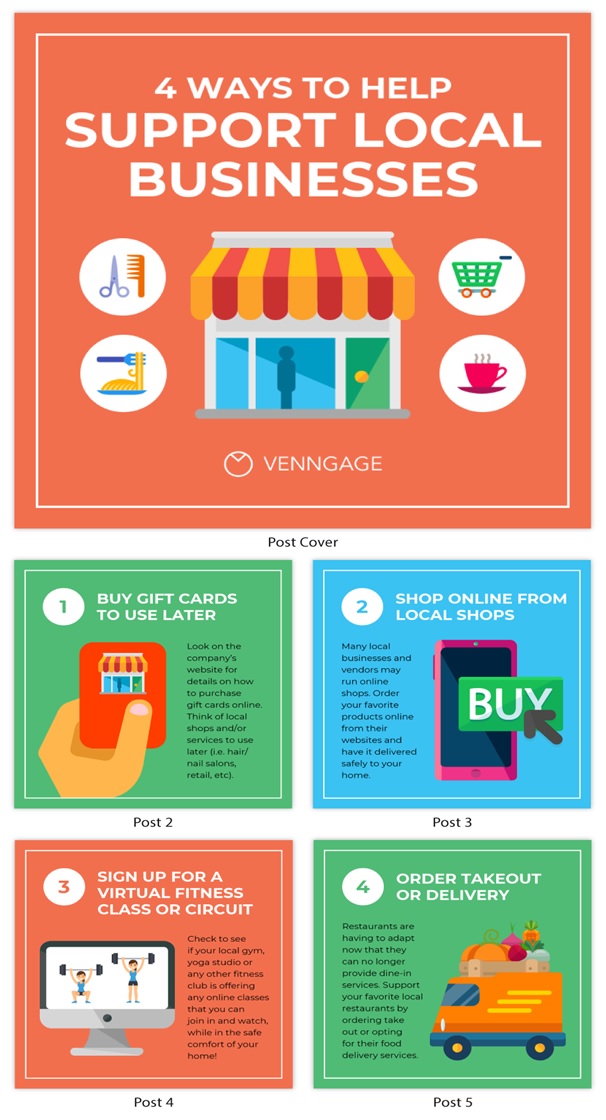
To get started, you can find out the most popular topics and posts on your blog by analyzing data on Google Analytics. Once you know what engages your audience the most, you can follow these tips on repurposing content:
Take-away
At a time when visual content has become an integral part of marketing strategies, it is important to find creative ways to leverage the potential of visuals to define clear strategies and reach your target audience. Visual marketing is more than an effective way to define and improve your strategy.
